We often examine data from different perspectives of different variables in order to make more accurate business decisions. In procurement management, you might want to know:
💡What are the quotations from suppliers for the XYZ material?
💡Which supplier did we purchase the most from?
This type of analysis helps us understand purchasing trends and price advantages that can help us improve our purchasing strategy. If this sounds like something you would like to analyze, the Pivot Table report might be a valuable tool for you. This report can quickly organize, classify, and compile large amounts of data, allowing you to clearly compare data using different variables.
Below we demonstrate how to use the pivot analysis report to review data on two sheets: the Material List and Purchase Requisition sheets.
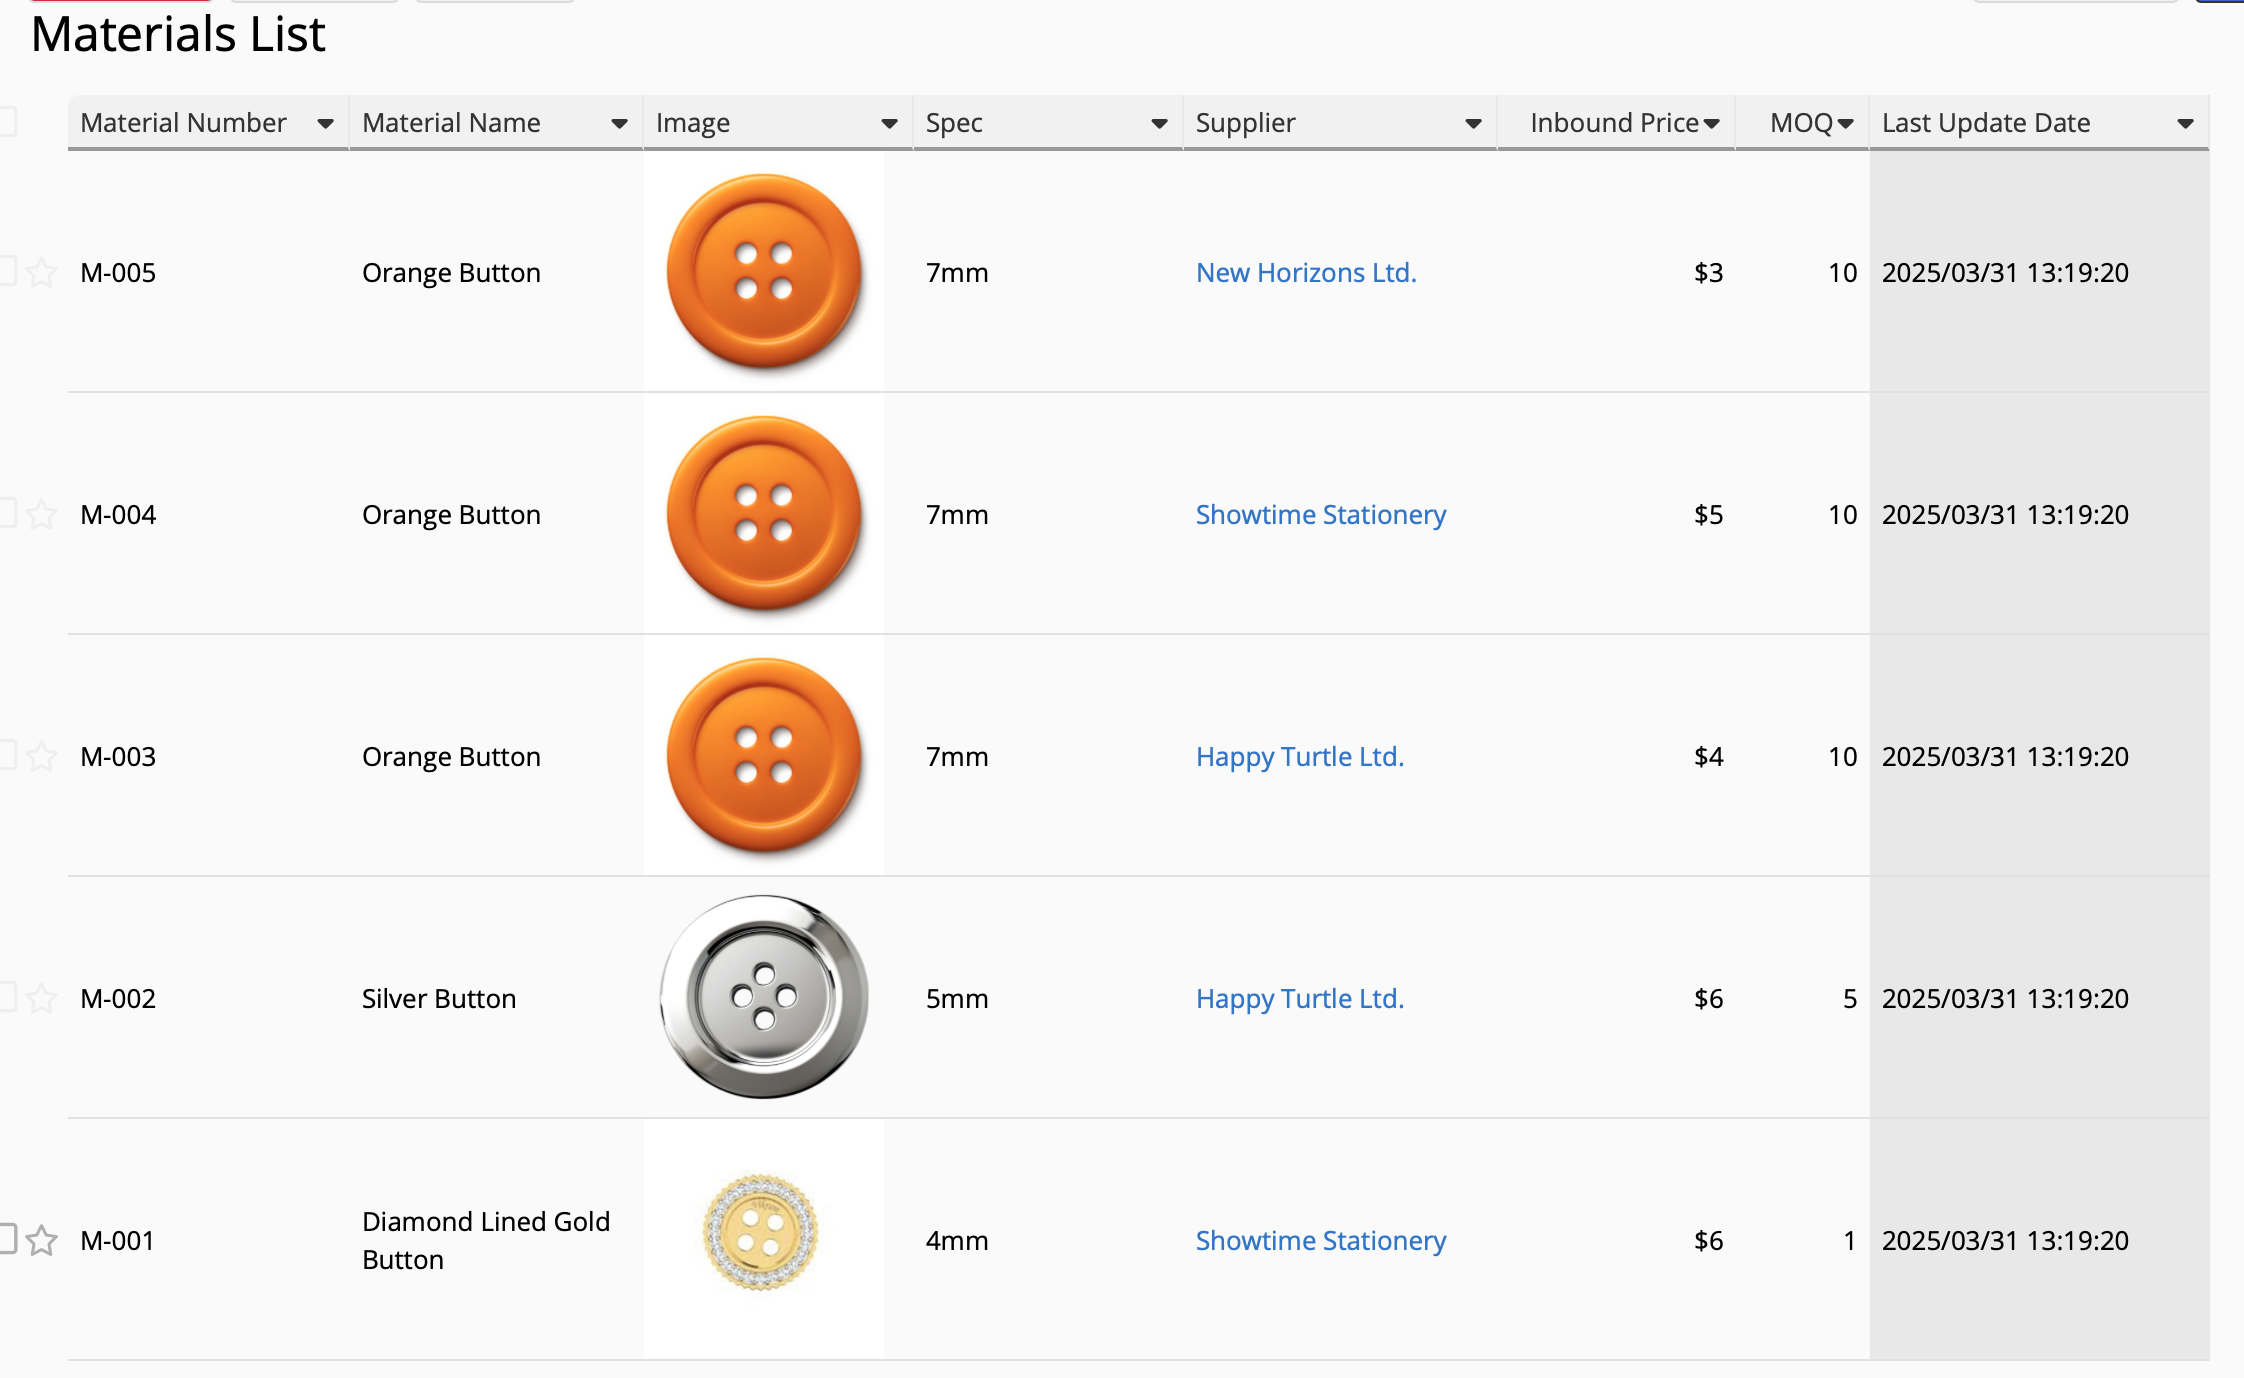
If you have a "Material List" sheet like this with columns like: Material Name, Purchase Price, and Supplier, among others:

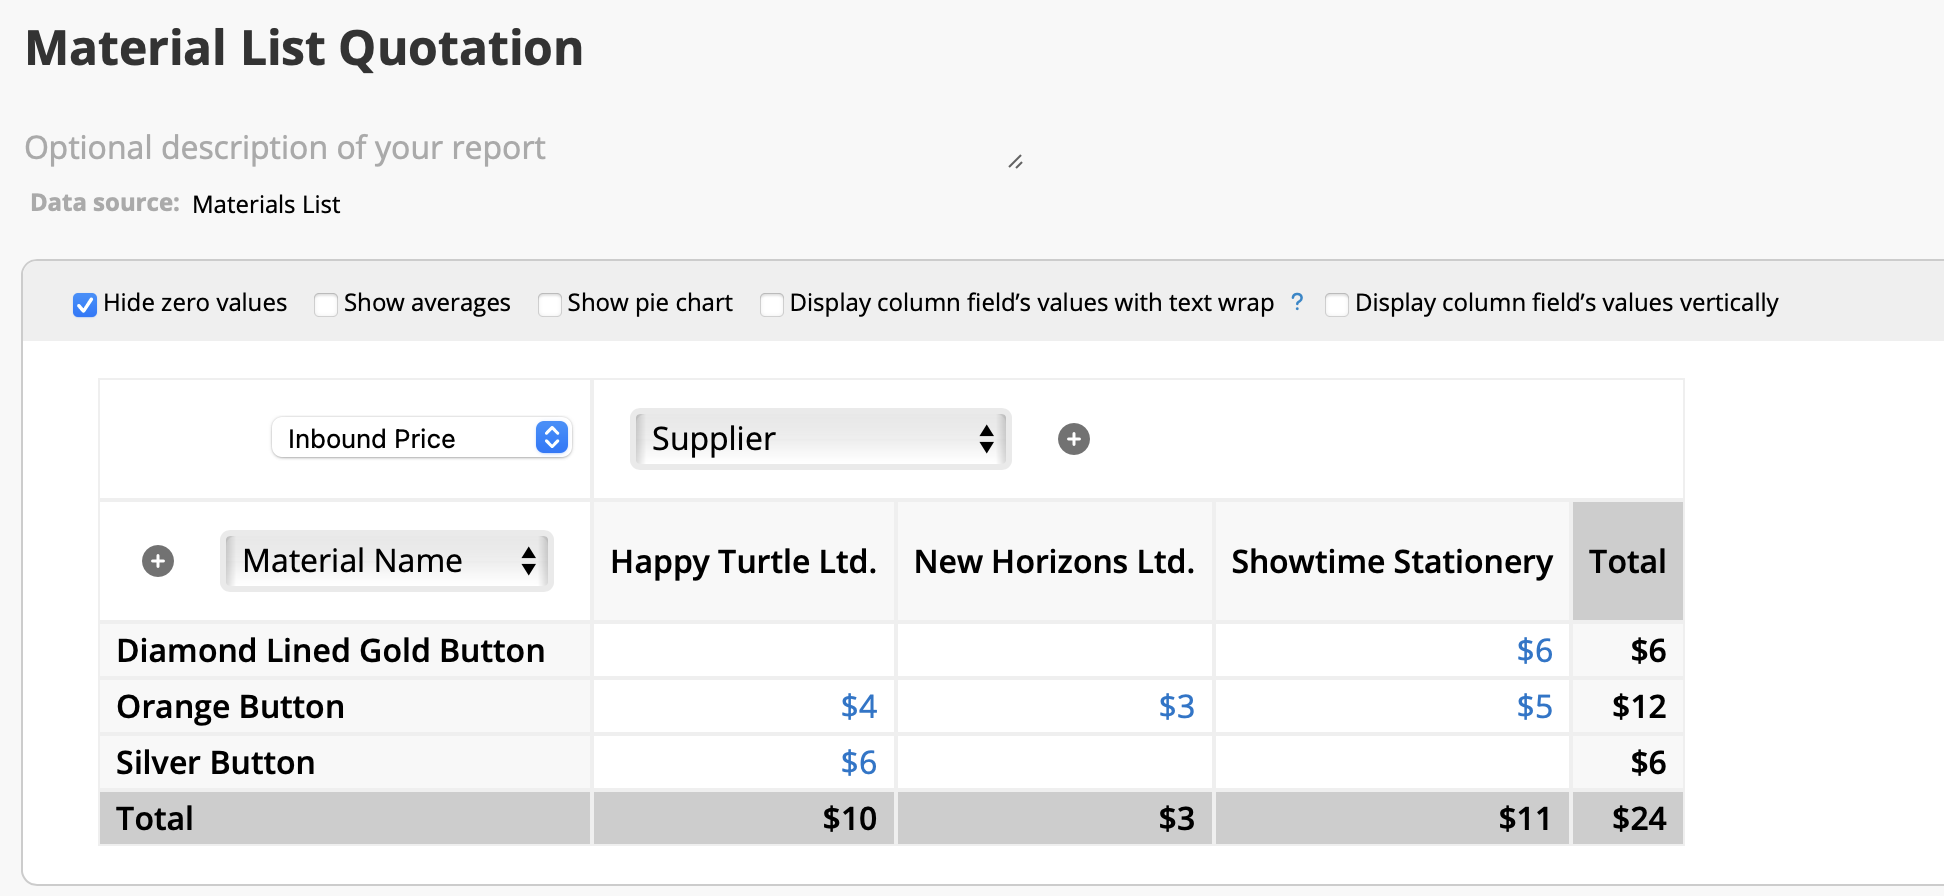
If you want to compare the quotations of different suppliers for the same material, you can set the following fields and follow the steps below after entering the Pivot Analysis Report page:
・Field of Analysis: Inbound Price
・Vertical Column: Suppliers
・Horizontal Column: Material Name
Once set up, you can then compare the prices among various suppliers at one glance.

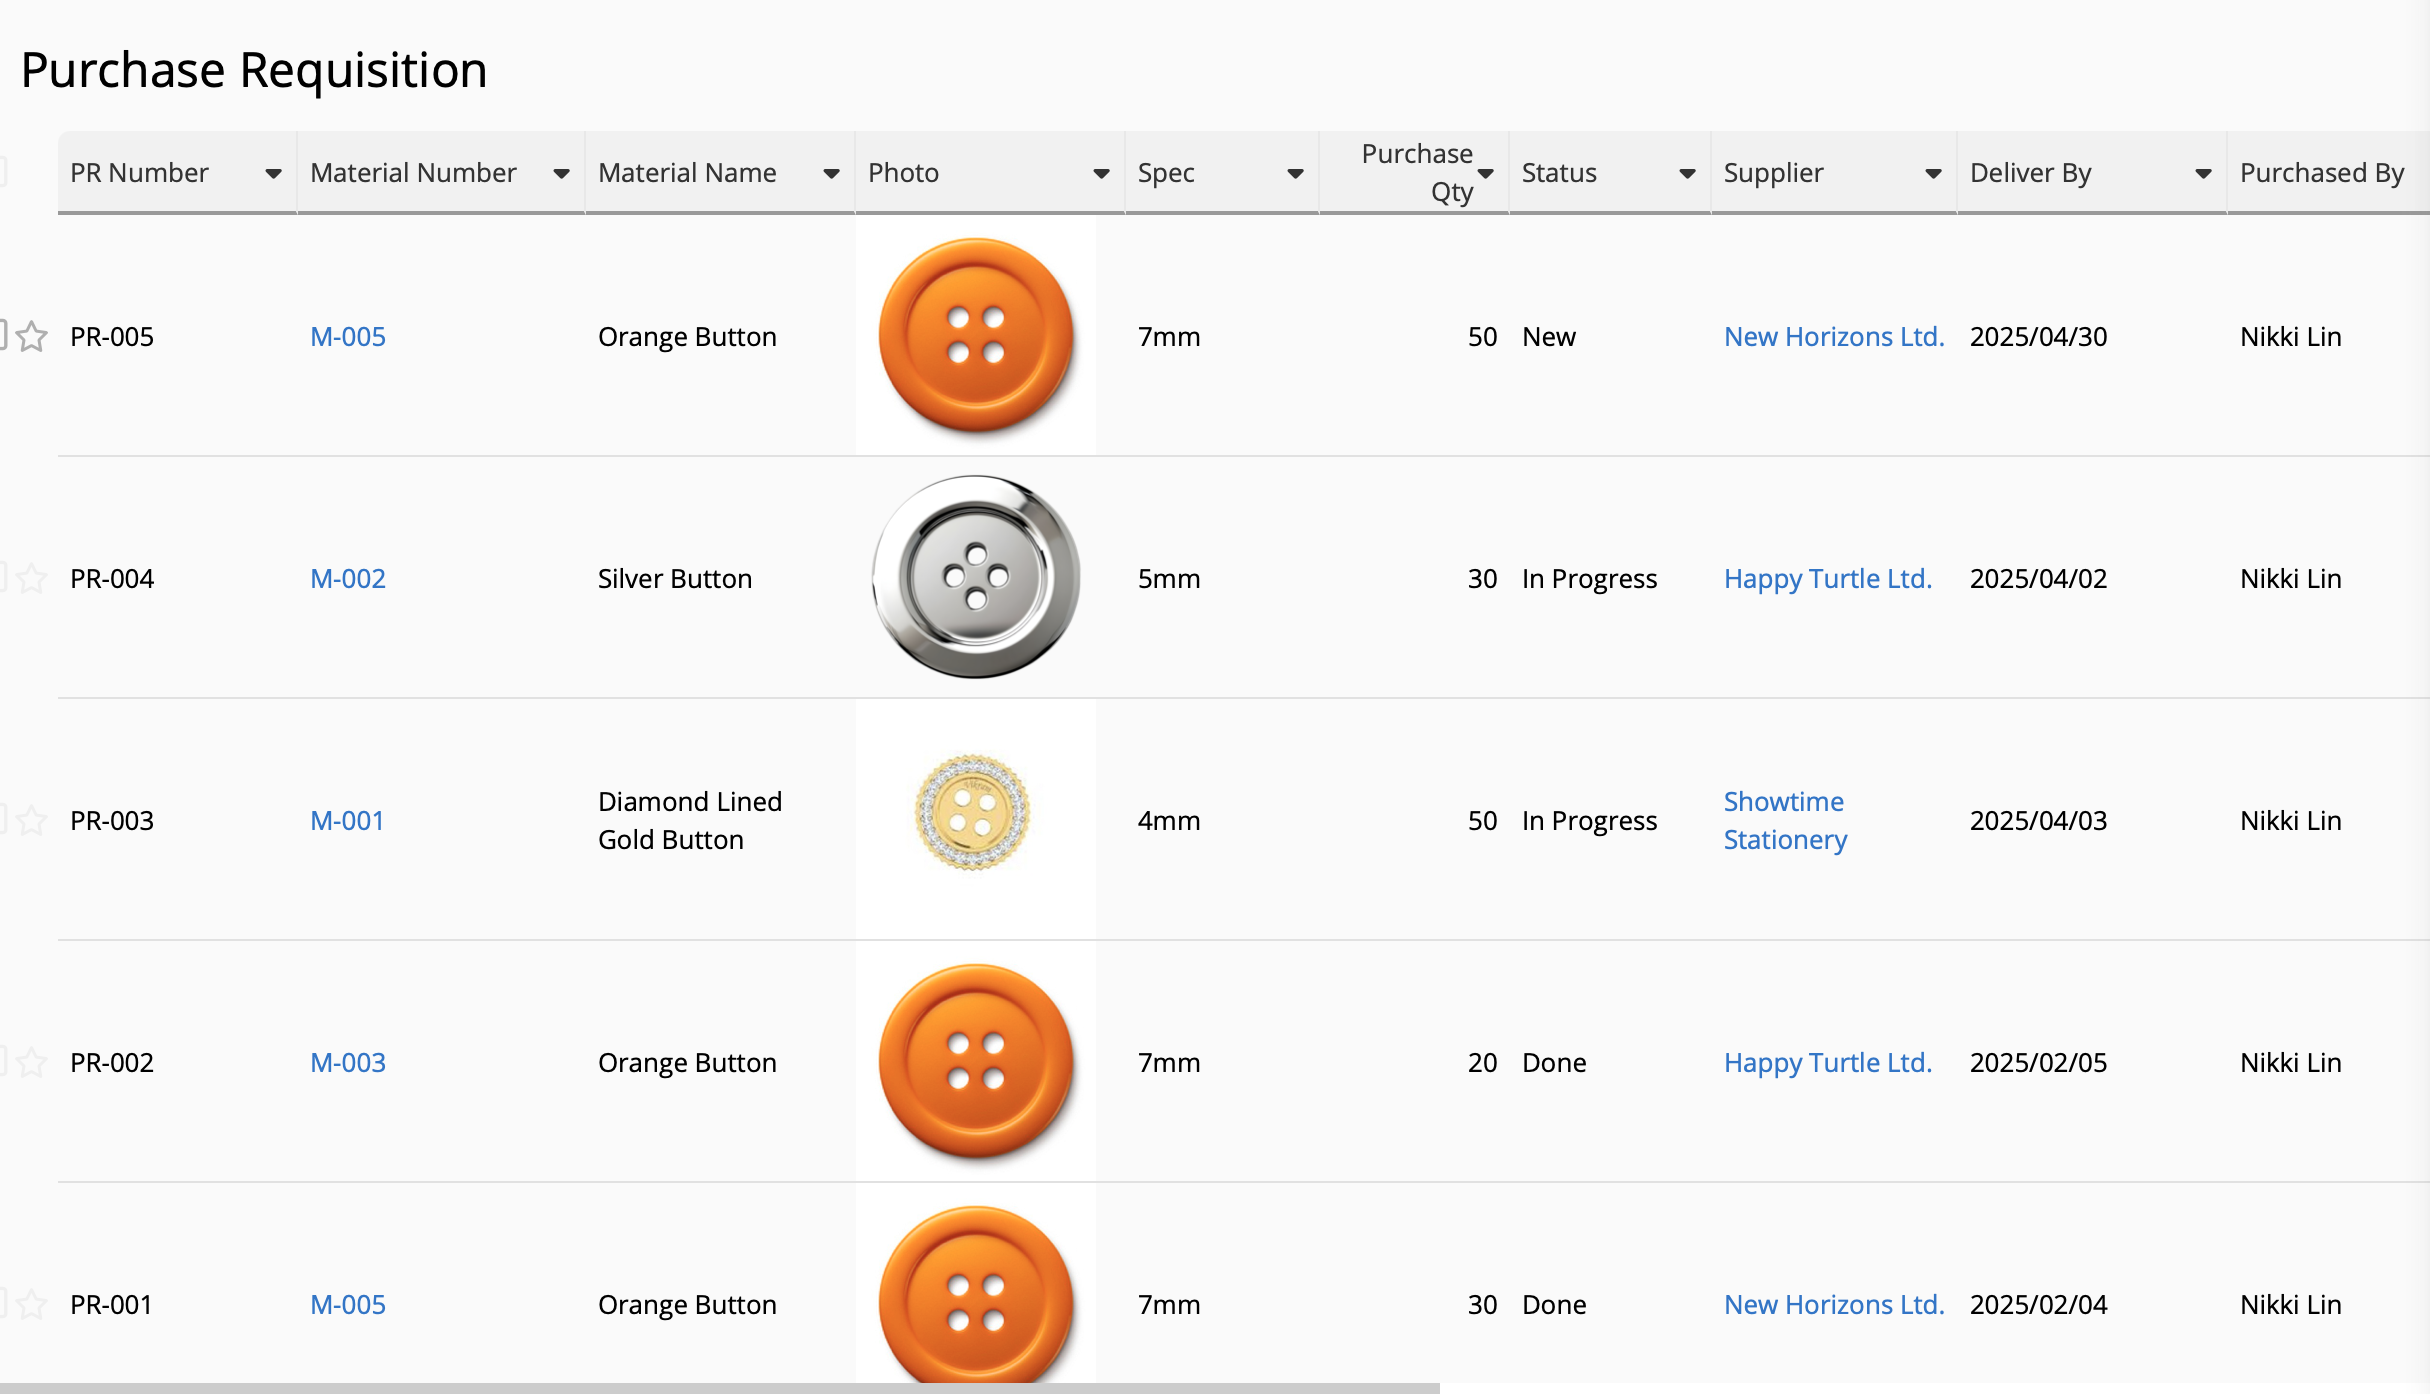
If you have a "Purchase Requisition" sheet like this that contains fields like Material Name, Supplier, Purchase Quantity, etc:

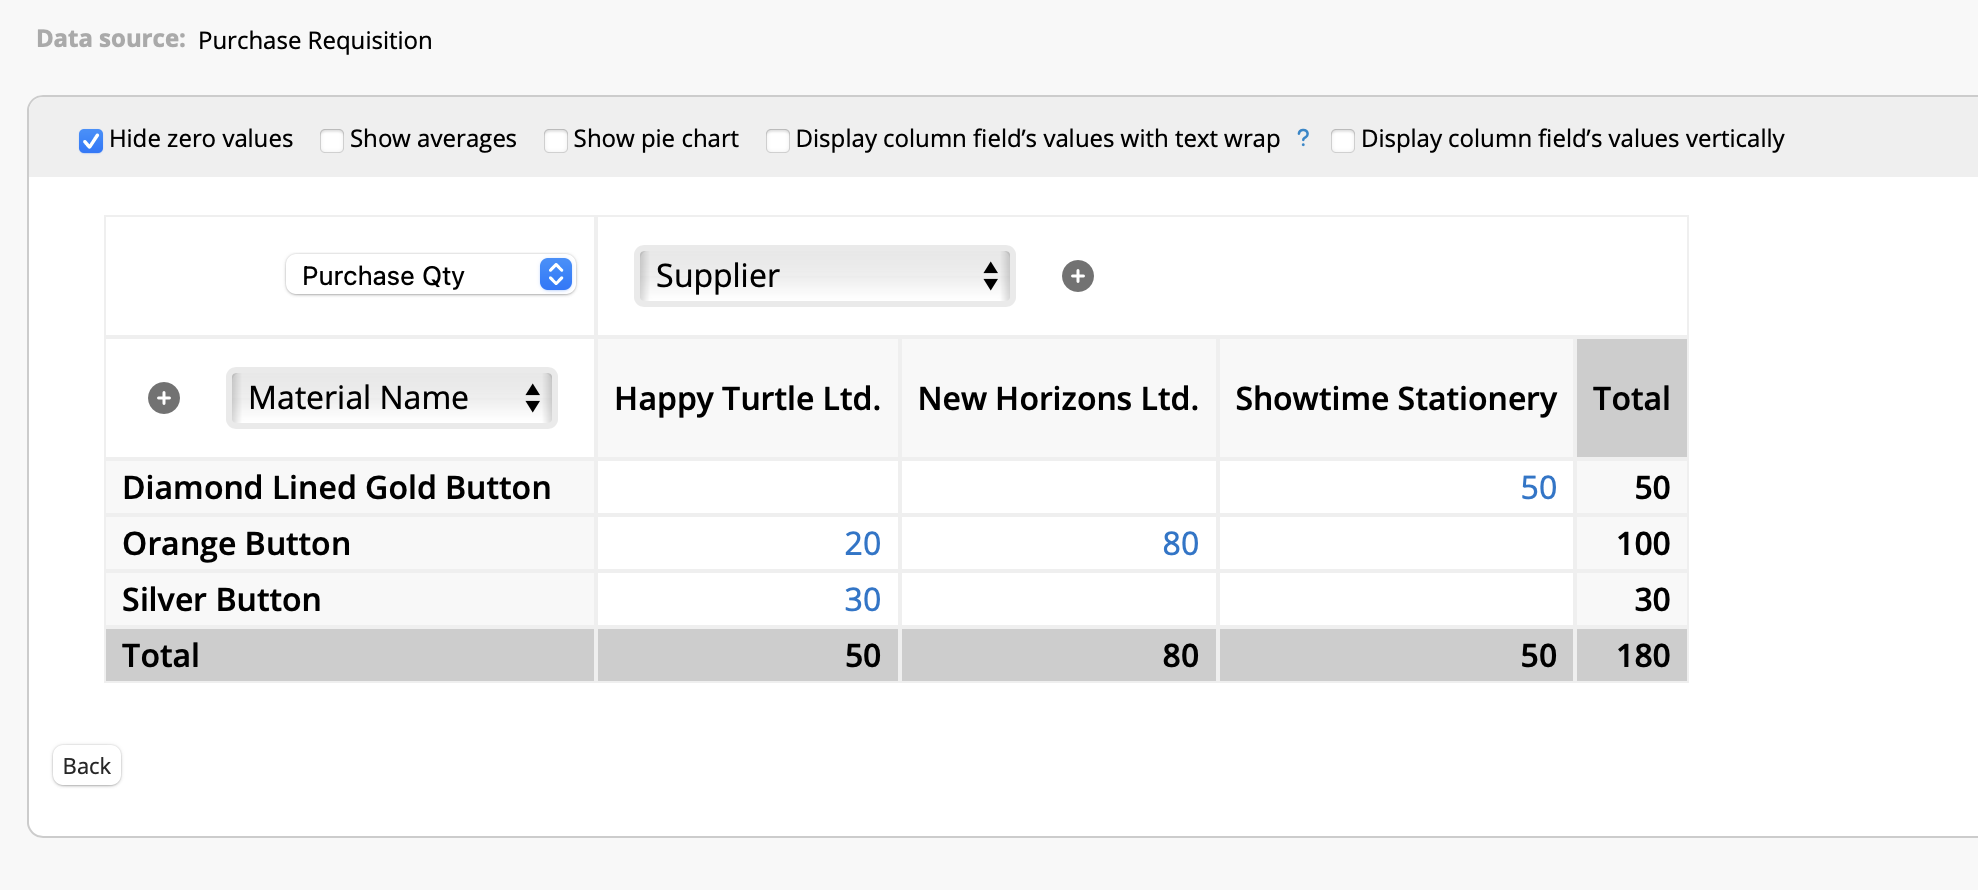
If you wish to know which supplier you've purchased from the most, you can use the Pivot Table from your Purchase Requisition sheet and modify the report settings as follows:
・Field of Analysis: Purchase Qty
・Vertical Column: Suppliers
・Horizontal Column: Material Name
This allows you to quickly analyze procurement data from each supplier and further analyze purchasing trends.

The Pivot Table reports allows us to easily classify and review quotations and purchase volume from different suppliers, making data-based procurement decision-making more efficient. If your data is more complex, you can adjust the field settings or add more analysis conditions to search for the information you need.
 Thank you for your valuable feedback!